
Digital Yet to Reduce Cash Usage in India


India’s economy has, like most countries, been buffeted by unexpected shocks over the last few years. Cash was disrupted by the November 2016 demonetisation exercise and by the pandemic. It is also facing a determined and unprecedented effort by the government to increase the use of bank accounts and digital payments. In this context, the cash management solutions provider CMS Info Systems (CMS) has issued its Cash India Vibrancy Report 2023. It provides context for India’s payments and a cash overview based on its CMS Cash Index™.
Drive to financial inclusion
The Indian government has been keen for people to have bank accounts. In August 2014 it introduced Prahan Mantri Jan Dhan Yojana (Jan Dhan) no-frill bank accounts. The number of Jan Dhan accounts has grown from 7.07 million in September 2014 to over 500 million in August 2023.
Rural India contributes about 35% of GDP. Although this will decline as India urbanises, it will remain a major driver of the economy. So, what happens in rural India matters. It is important, therefore, that most of the growth in Jan Dhan accounts has come from rural India, with the number of accounts in September 2014 rising from 4.23 million to 324.5 million, an increase of 76.6 times compared to the 56.9 times increase in urban India.
As with other countries, the unbanked and underbanked, a lack of digital literacy and uneven levels of digital penetration mean cash remains a necessity. The 2021 Global Findex World Bank database found that 22% of Indians still do not have bank accounts. In addition, 70% of account holders used cash for merchant papers and not payment cards, mobile phones or the internet.
What has happened to cash?
Cash in circulation (CIC) as a proportion of GDP has averaged 12.4% for the last ten years. It reached a low of 8.7% in 2016. The Asian Development Bank Institute (ADBI) published a paper in 2019 which found that India’s cash growth was growing quite closely in line with transaction demand growth up until 2016.
However, the November 2016 demonetisation has broken this relationship. Despite that, as the chart below shows, the demonetisation has had little impact on the long term growth of the value of cash in circulation.
ATM withdrawals
CIC to GDP gives one view of cash, ATM withdrawals give a more transactional perspective.
As elsewhere, at the start of the pandemic cash withdrawals by volume of transactions made by debit cards fell significantly, 46% in April compared with March 2020. The fall in the second wave of the pandemic in April 2021 was marked, but less, at 21%. Volumes today are 42% higher than in May 2021.
CMS mostly focuses on value rather than volume, although it has that data. Average value of cash replenishment per ATM rose 11% in the financial year 2023 compared with 2022. It is also able to break this data down by state, by time of year (ie. festivals and holidays), and by Metro, Semi Metro and Semi Urban and Rural (SURU) regions. Growth has been steady in all regions, but growth in Metro regions has been faster than in SURU regions.
CMS attributes higher ATM replenishments to higher inflation during the financial year 2023. Inflation in rural areas tends to be relatively lower than in urban locations. CMS argues that ATM replenishments holding their ground in SURU locations is an indication of higher usage and need for cash due to challenges inherent in digital payments in these areas.
As part of the drive to increase financial inclusion, there has been a boost in the number of new bank branches in SURU regions.
The number of new branches in rural and semi-urban regions in 2023 increased respectively in absolute terms 128% and 82% in 2023 compared with 2021. In comparison, metro and urban locations saw increases of 63% and 44% between 2021 and 2023. More branches mean more ATMs.
CMS Cash Index ™
CMS has created an index based on cash that goes into circulation via ATM channels and cash collected from retail channel points covered by CMS. It has compared its data with the S&P Global India Composite Purchase Manager Index (PMI), which is based on weighted averages of comparable manufacturing output index and the service business activity index. The S&P Global India Composite PMI gauges the expansion and contraction in economic activity.
When the CCI and S&P Global India Composite PMI are mapped, they neatly mirror each other except for unusual macroeconomic events such as the demonetisation exercise and the pandemic and resulting lockdowns. CMS collects underlying data from ATMs and retail channels in 97% of Indian districts and over 16,000 Indian Postal Index Number.
It believes that the CCI is a fair proxy for gauging the vitality and economic health of India, including consumption behaviour across states and sectors.
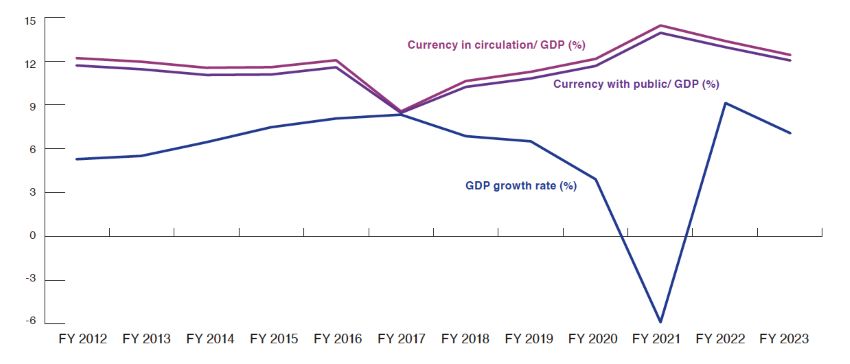 Currency in circulation has a direct relation
with economic growth – Source: DBIE
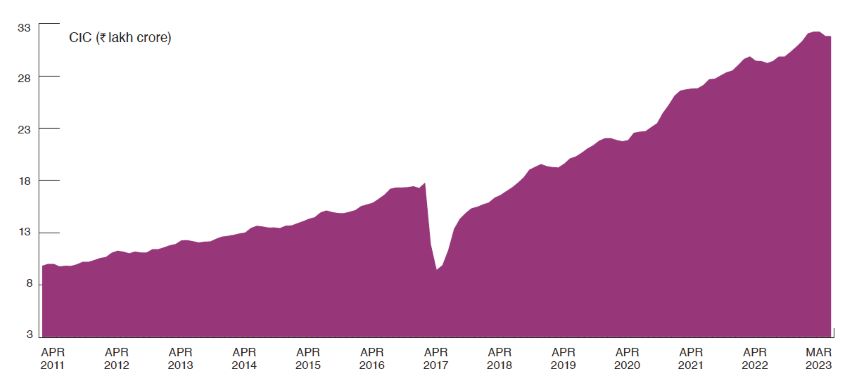 Currency in circulation grew by 5.33% and 33.98% on 1
year and 3 year horizon in March 2023 – Source: DBIE
CMS collects data from Retail Cash Management (RCM) points for key industry segments – Banking Financial Services and Insurance (BFSI), discretionary spends, non-discretionary spends, organised retail and transportation. In the financial year 2023 average cash collection from RCM points within the transport segment was 1.38 times higher than in the year before.
Digital payment challenge
The Indian government has been subsidising the cost of keeping Unified Payment Interface (UPI) transactions free for use. For each of the last three union budgets, the government has allocated R15 billion ($180.45 million) for the digital payments sector. The latest budget highlighted this may increase to R21.37 billion in 2024.
In August 2022 a Reserve Bank of India (RB) discussion paper said that stakeholders collectively incur an estimated cost of R2 for processing an average peer to merchant UPI transaction for a transaction worth R800, 0.25% of the transaction value. The RBI asked the question, ‘In the context of zero charges, is subsidising costs a more effective alternative? If UPI transactions are charged, should the Merchant Discount Rate for them be a percentage of transaction value or should a fixed amount irrespective of the transaction value be levied? If charges are introduced, should they be administered (say, by RBI) or be market determined?’
It appears that the days of subsidising digital payments are not ‘forever’. It will be interesting to see what happens come that day.
Final word
The correlation between the CMS Cash Index, CIC as a proportion of GDP and the S&P Global India Composite PMI offers a useful tool to consider economic activity in India. As ever, differences from the trend or the other indexes are as useful as the overview itself.
The sensitivity of cash to inflation and economic shocks reflects its predominance in day-to-day payments, something easily forgotten in less cash economies. It will be interesting to track how cash usages changes as India’s digital transformation matures.
Finally, the CMS article does show the core rolls that cash continues to play in India. It also shows what a diverse country India is. Cash fulfils a key role that digital payments don’t provide, namely offering an immediate mode of payment that transcends generational gaps, economic strata, digital literacy levels, and geographical boundaries. Crucially, it grants consumers the freedom of choice and empowers them with financial agency.
Subscriber content
Read the full article
Full access to Cash & Payment News articles, newsletters and archives.