
Cash Usage and the Underground Economy


There is an assumption that cash is a driver of the shadow economy, but this is not proven by empirical evidence. Occasional paper 649 from the Banca d’Italia 1 used the decision to increase the limit on cash usage from €1,000 to €3,000 in January 2016 in Italy as an opportunity to study what happened to cash and the shadow economy. It found that increasing the cash threshold boosted spending, but it also increased the size of the underground economy.
The size of Italy’s shadow economy, the preference for paying in cash and Italy’s history of limiting cash usage makes it an interesting place to assess the relationship between cash and the shadow economy.
The Italian National Statistics Institute (Istat) estimated that in 2018 11% of the total value added to the economy came from the shadow economy as a result of under reported value or value produced by undeclared work. At the same time the 2019 Study on the Payment Attitudes of Consumers in the Euro Area (SPACE) found that 82% of transactions in Italy were in cash (58% by value) compared with 73% across the whole euro area (48% by value).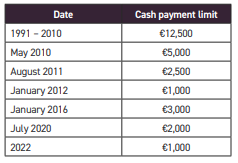
In 2019 Rainone and Valentini 2 used TARGET2 3 system data on payments to show that a higher demand for large denomination banknotes in Italy drove the demand for cash. In 2020 Russo 4 found that Italy’s change to a €1,000 cash limit induced a higher reduction in cash expenditure among ‘potential cash evaders’ (households with one self-employed person in them) than in other households.
Data and modelling approach
This study used aggregated anti-money laundering reports filed with the Italian Financial Intelligence Unit (UIF) by banks. These reports are the official estimates of under-reporting by firms of cash transactions – under-reporting of value added, value added by undeclared work, off-book rents and tips, results of reconciliation procedures of independent estimates of demand and supply for goods and services.
The authors used an instrumental variable approach and a difference-to-difference approach. Studying the data from one country made it less challenging to take into account other potentially affecting factors. The latter approach exploited the change in the maximum threshold for cash transactions introduced in 2016. Effectively it is a measure of the effect of that policy on tax evasion.
The 2019 UIF data had 108 million aggregated records representing 359 million single transactions worth €62 trillion. The cash data was for transactions, deposits and withdrawals with a value of over €15,000 for all kinds of transactions. Intermediaries also transmit data relating to cash transactions below the threshold and these were considered as fractional transactions. Cash transactions accounted for 6.8% of the total number of transactions.
The analysis calculated the share of cash transactions (both deposits and withdrawals) over total transactions carried out at Italian banks drawn from the subset of those exceeding the reporting threshold and involving only deposits and withdrawals made by firms in the private non-financial sector. This resulting share, on average equal to 3.8%, differs from the 83% of transactions reported in the SPACE study because of the subset of data used.
Variables that impact the size of the shadow economy
The study used 102 of Italy’s 107 provinces as a matching key.
To understand the data, the authors included 17 control variables to account for the most important factors fostering the hidden economy. For example, the tax burden (the higher the tax burden, irrespective of the type of taxes, the greater the avoidance), the controls and administrative procedures on tax avoidance, social norms, the standard of living, the diffusion of small businesses, the unemployment rate and the share of the population who are foreign etc.
Findings
The findings corroborated the known north/south divide in the Italian economy and society, with the gradient of that change matching the geography. Cash transactions as a proportion of all transactions in Milan in the north for example, was 0.4%, while in Enna, in the south, it was 12.3%.
The study faced the challenge of controlling for all the factors that can affect the propensity to evade taxes and it had to classify the provinces according to the intensity of the treatment, as the ban on cash usage was enacted at the national level. Despite this, the evidence indicated that stricter limits in the use of cash are an effective instrument to tackle tax evasion.
A 1% increase in the use of cash translated into an increase in the size of the shadow economy of 0.8-1.8%, and that the decision to raise the cash threshold from €1,000 to €3,000 to boost spending had the side effect of shifting the same share upwards by about 0.5%.
1 - Written by Michele Giamatteo, Stefano Lezzi, Roberta Zizza.
2 - Rainone E. and M. Valentini (2019) ‘Tax Evasion Policies and the Demand for Cash’, Banca d’Italia, manuscript.
3 - The European Central Bank’s real time gross settlement system.
4 - Russo F. F. (2020) ‘Cash Thresholds, Cash Expenditure and Tax Evasion’, CSEF Working Paper no. 579.
Subscriber content
Read the full article
Full access to Cash & Payment News articles, newsletters and archives.