
Changing Cash in Circulation in Italy

The Banca d’Italia (BdI) issued a technical paper 1 in July analysing 20 years of cash data to understand cash circulation, important to a central bank for planning cash production and its monetary policy implementation framework.
The paper focused on three key areas – the role of banknote flows from abroad, changes in institutional frameworks, and the domestic demand for cash for transactions compared with for other components, including liquidity hoarding.
The paper found that, at a time when the number of cash transactions was reducing, making cash less relevant, cash dynamics could be explained by legal limits on cash payments and money holdings for precautionary purposes. The pandemic has increased the size of precautionary holdings, driven by economic uncertainty and restrictions on mobility, but the reduction in lodgements at the central bank has been an important part of this increase.
Liquidity hoarding should imply a sharp, but temporary, increase in cash holdings, but the data shows cash circulation steadily increasing. The paper explored whether increased circulation reflected a surge in foreign, rather than domestic, demand and considered the role of the shadow economy. Counter-intuitively, the surge in cash demand happened at a time of falling consumption.
Italy has imposed increasingly strict limits on cash payments, it has seen a steady substitution of cash by other payment tools, and in the pandemic it saw a collapse of lodgements of cash at the central bank, which BdI describes as ‘forced’, due to the restrictive pandemic measures, rather than ‘voluntary’.
Overview of 20 years of euro circulation in Italy
The paper used data from when the euro was first issued. It measured circulation as the difference between the value of notes issued and the value returned, excluding notes issued that went abroad or notes issued abroad that entered Italy.
It found four distinct phases over the 20 years.
2002-2010: A steady upward trend in circulation after the euro was launched
The growth was attributed to:
The public replacing hoarded notes, up until the end of 2003 (and including deutschmarks, dollars and Swiss francs).
A change in the denominational structure, with more higher value notes (pre-euro Italy had one denomination worth more than €50 and four denominations worth less than or equal to €5).
A growth in foreign demand for low and high value notes. Foreign demand was calculated using the direct approach based on official statistics for wholesale bank-to-bank movements, remittances and travellers.
During this period non-transactional notes played a prominent role. The average growth rate in nominal GDP was 3.8%. The cash-to-GDP ratio, a rough indicator of the domestic non-transactional component, increased from 4.9% in 2002 to 9% in 2010. Middle and high denomination notes increased considerably while low value notes declined. The global financial crisis saw net issuance in the fourth quarter of 2008 go up 9%, mostly in €200 and €500 notes.
2011-2015: A reduction in circulation
In this period Italy experienced a sovereign debt crisis and changes in legal payment limits.
In the fourth quarter of 2011 Italy’s sovereign debt spread surged and there was a fall in confidence in the solvency of public debt. The result was cash circulation increased 6%.
In an attempt to reduce tax avoidance, Italy reduced the limit on cash payments. It also introduced Anti-Money Laundering (AML) limits on the use of €200 and €500 notes. These actions saw the use of these denominations fall 64% in 2012 and a further 23% in 2013. Issuance of the €20 and €50 increased.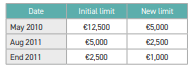
By quarter 4 2012, the annual increase in cash circulation had fallen to 4.7% compared with the average increase over the 20 years of 8.6%. Between 2012 and 2015, the circulation to GDP ratio was stable, reflecting how much cash circulation had moderated.
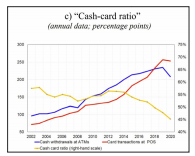
During this period, important regulatory changes to boost electronic payments were made in Italy. The cash-to-card ratio is the ratio between the value of withdrawals at ATMs and card payments at the point-of-sale (POS).
It is regarded as a good proxy for the preference of households for using cash compared with electronic payments at the POS. The BdI data suggests the ratio has fallen since 2013, when these changes were made.
2016-2019: A moderate and stable positive growth. The end of €500 issuance.
The rate of circulation was positive and the cash-to-GDP ratio increased. Demand for higher value notes did not recover, perhaps due to the ECB’s announcement in May 2016 about the ending of issuing €500 notes.
2020- : A sudden and exceptional acceleration. The pandemic.
In the second quarter of 2020 issuance was 9.3% on a yearly basis. Behind this figure, though, was a reduction in lodgements of notes at the BdI of 26.3% and of withdrawals down 7%. The increase in circulation was, therefore, driven significantly by the reduction in lodgements.
In addition, there was less spending overall and, effectively, no tourism. As a result of the latter, the supplementary issuance of cash from abroad was negative rather than its usual 3% contribution to cash issuance.
The 2016 – 2021 period has also seen new cash limits introduced.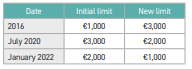
Survey of household income and wealth
BdI has regularly surveyed the public. Highlights in its findings being:
Older people, those in the south of Italy, low-income and lower educational groups use more cash.
Average monthly spending in cash is €850 per household.
Electronic payments at the end of 2019 per capita were 125 compared with a European average of 286.
Access to cash is not an issue in Italy.
32% said they were using less cash and 27% using card payments more, but these changes are likely to be permanent.
Italy had 49,000 ATMs at the end of 2019, 813 per million people, slightly more than France, which had 785.
Italy had significantly more POS infrastructure than other large European countries. Italy had 3.5 million, France 2, Spain 1.7 and Germany 1.3 million.
In 2016 86% of payment transactions were made in cash, 68% by value. The ECBs SPACE 2 survey in 2019 showed a small drop in number to 82% and by value to 58%. The 2020 IMPACT survey did not capture that data.
BdI also commented on changes to the way people access cash that have occurred during the pandemic, which has seen more bank-to-bank recirculation of notes and increased access to cash through cash back/ cash-in-shop withdrawals.
These developments have implications for BdI’s ability to understand cash flows in the future since good data will be harder to get.
Final thought
One could interpret these findings as suggesting a country still strongly favouring cash but one that has started to change.
1 ‘Inside the black box: tools for understanding cash circulation’: Banca d’Italia, Number 7 – July 2021 (N.7-MISP.pdf (bancaditalia.it)). By Luca Baldo, Elisa Bonifacio, Marco Brandi, Michelina Lo Russo, Gianluca Maddaloni, Andrea Nobili, Giorgia Rocco, Gabriele Sene, Massimo Valentini.
2 SPACE = Survey on the Payment Attitudes of Europeans.
Subscriber content
Read the full article
Full access to Cash & Payment News articles, newsletters and archives.